Our Default Managed Portfolio
Our first and most popular portfolio by far.
| 2019 | 2020 | 2021 | 2022 | 2023 | 2024 | 2025 | |
| Moderate Portfolio | 19.53% | 3.63% | 16,30% | -17.43% | 2.97% | 12.66% | 21.63% |
| FTSE 100 Total Return Index | 12.38% | -8.48% | 18.29% | 2.56% | 3.58% | 9.88% | 22.80% |
Chart Details
- If you hover your cursor on your computer, or touch your smart device screen over the “double over a decade” line on the chart, you can see that 100% invested became 200% on 01/01/2018, which was 10 years from commencement.
- To remain on target, savings must double again to 400% by 01/01/2028. (100 x 2 = 200, 200 x 2 = 400).
- Growth to our moderate managed portfolio has now added 259% to the original capital invested.
- Every £100 invested originally is now worth £359.
Our Calculations
- The Managed Portfolio returns are net of all charges. It is the actual return received by clients.
- Any Index shown is a total return including dividends. It is a hypothetical return as it is not possible to invest directly in an index. A fair comparison would deduct both a fund charge and a platform charge which would cost upwards of 1/3rd of a percent (0.33%) per annum.
Risk Warnings
It’s important to remember;
- Past performance isn’t necessarily a guide to the future.
- The value of investments can go down as well as up.

Moderate Portfolio Description
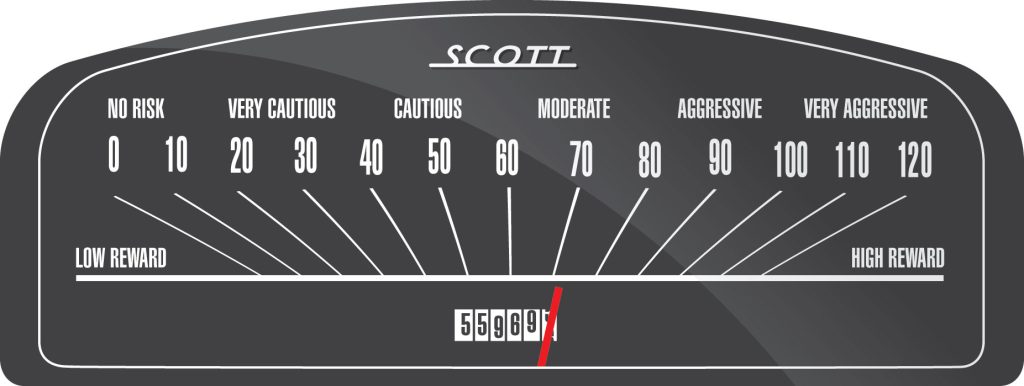
A typical Balanced long-term (+5 years) asset allocation would invest between 40% and 85% (dependant on the financial climate) in equities with the remaining percentage being invested in a combination of fixed income paying investments, alternatives and cash. Moderate level investment risk.
Industry data suggests around 2/3rds of all investors are comfortable invested in a managed balanced portfolio or fund.
The goal of this portfolio is to attempt to double your savings every decade.
A 7% per annum compound return is required to turn every original £100 into £200 over 10 years.
Now Read on to see whether this portfolio could be suitable.
