
This is potentially a long read if you choose to read it all. If however you do not have any investments held within a General Account you can pass on a long technical section and fast forward to later in the blog. The jump link comes about a page lower from here.
I like the US holiday of Thanksgiving. The holiday is held on The fourth Thursday of November with the annual day set in stone by Congress in 1941.
Thanksgiving is day for US families to get together and enjoy eating too much turkey. Many watch a full programme of (American) football games with the extended family. A day to be grateful and celebrate being an American. This Thanksgiving finds us on a ship full of Americans and we too are celebrating alongside them for differing reasons. We are grateful that Wednesday’s UK budget wasn’t half as bad as expected. It wasn’t good for hard-working retired savers, but it could have been much, much worse.
It’s sad to think that if we in the UK tried to celebrate the history of our once great nation, on any particular day like Thanksgiving, half of the population would accuse us of being racist or colonialists. Why can we not be proud of our nation and culture like the Americans surely are?
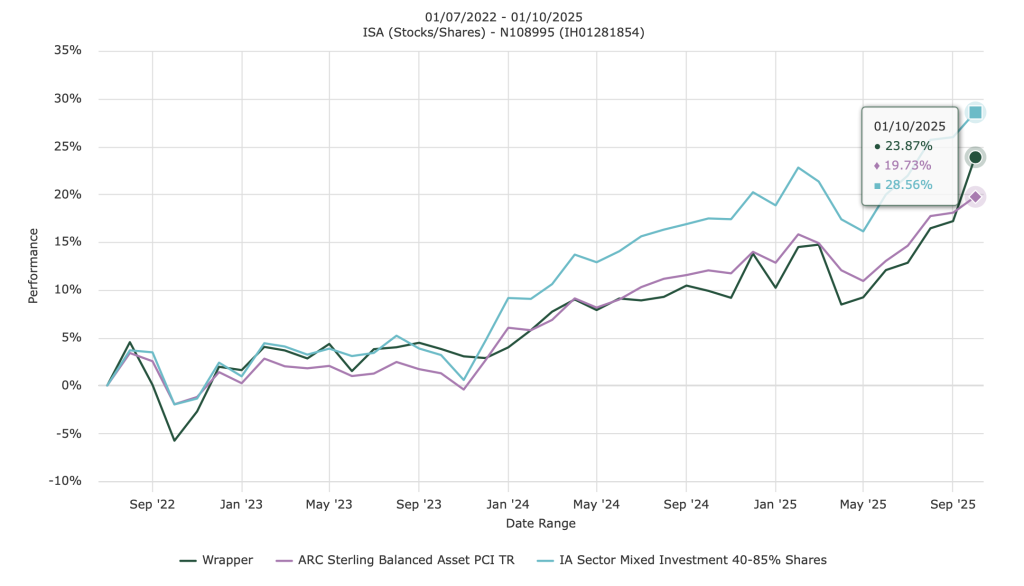
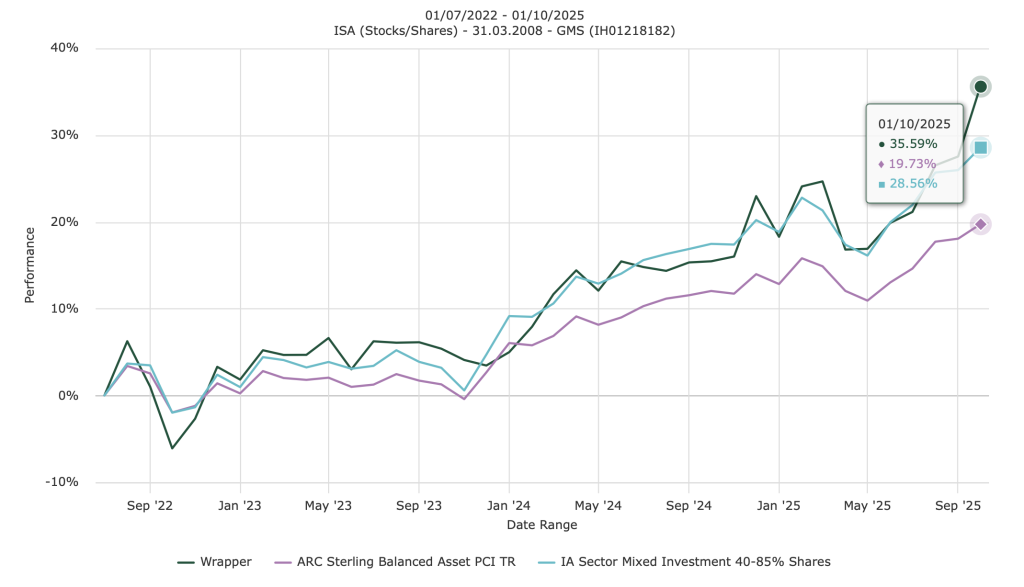
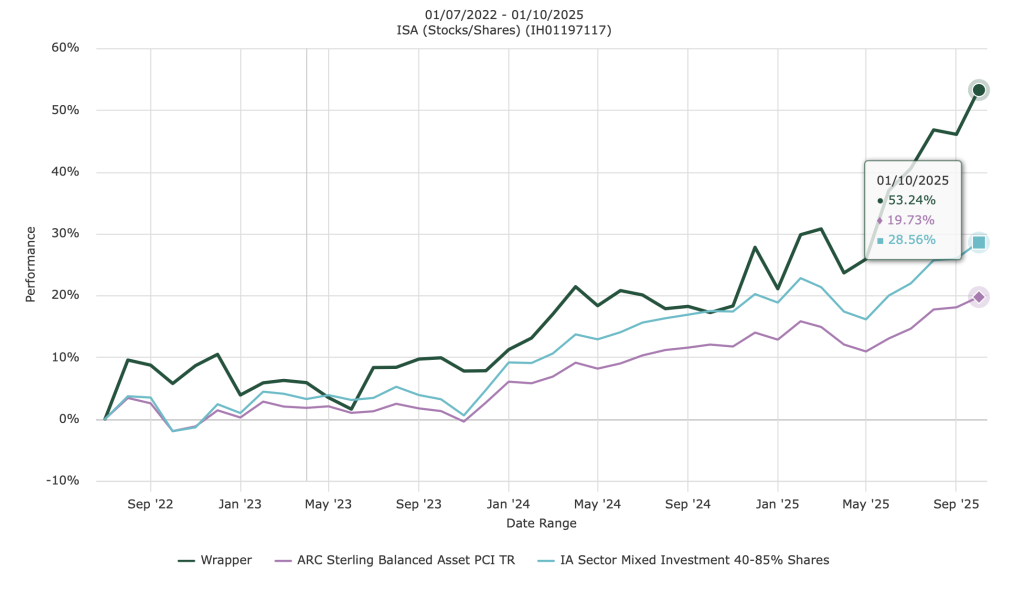
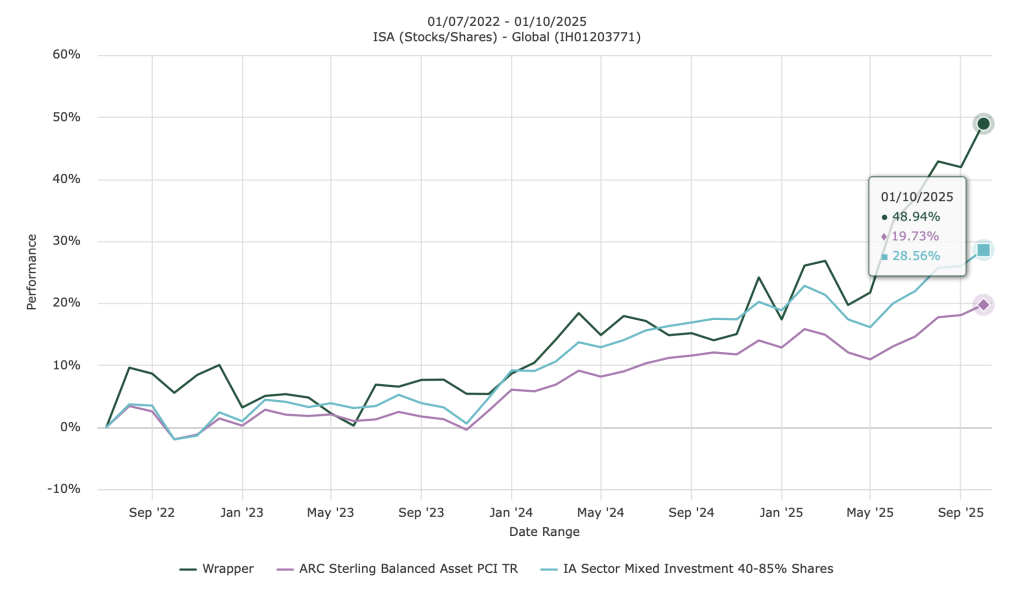
We can afford to celebrate, particularly with the Americans, as the majority of our investment growth this year has come from harvesting the strong performance of US companies. Although the majority of Americans celebrate Thanksgiving, half of Americans are not thankful for the current political leadership in the US. This dis-satisfaction with our current government is also true on this side of the pond, for the majority of the UK population too. We both live in nations that are deeply split, but here in the UK we don’t have a national holiday to try to bring individuals together to resolve their differences. It’s a pity.
Anyway let’s talk about the real reason we in the UK are celebrating the day after Wednesday’s budget on Thanksgiving day. The tax rises announced weren’t as bad as we all feared. This blog was originally titled “The nightmare before Christmas”, perhaps I will save that for Torsten Bell’s first budget next year when he takes over the reins as the next Chancellor of the Exchequer.
Continue reading “Thanksgiving”